The Visualisation Designer
The Visualisation Designer is an application you launch from a Squonk Data Manager project. It builds interactive pages that show the data files in that project — scatter plots, histograms, molecule grids, 3D structures and ligand–protein interaction views — and, crucially, wires them to each other, so that selecting points in one chart changes what the others show.
Nothing here requires code. You describe the visualisation once, save it into your project, and it is there the next time you open the application.
The two halves
The application has one tab you build in and any number of tabs you look at.
The Design tab is a canvas of nodes joined by connections. A node is either a source of data (a dataset read from a file in your project, a join of two datasets, a set of calculated columns) or a view of it (a chart, a molecule grid, a 3D viewer). A connection carries something from one node to another — a dataset, a selection of rows, a set of files, a sketched molecule. This is where you say what exists and how it is joined up.
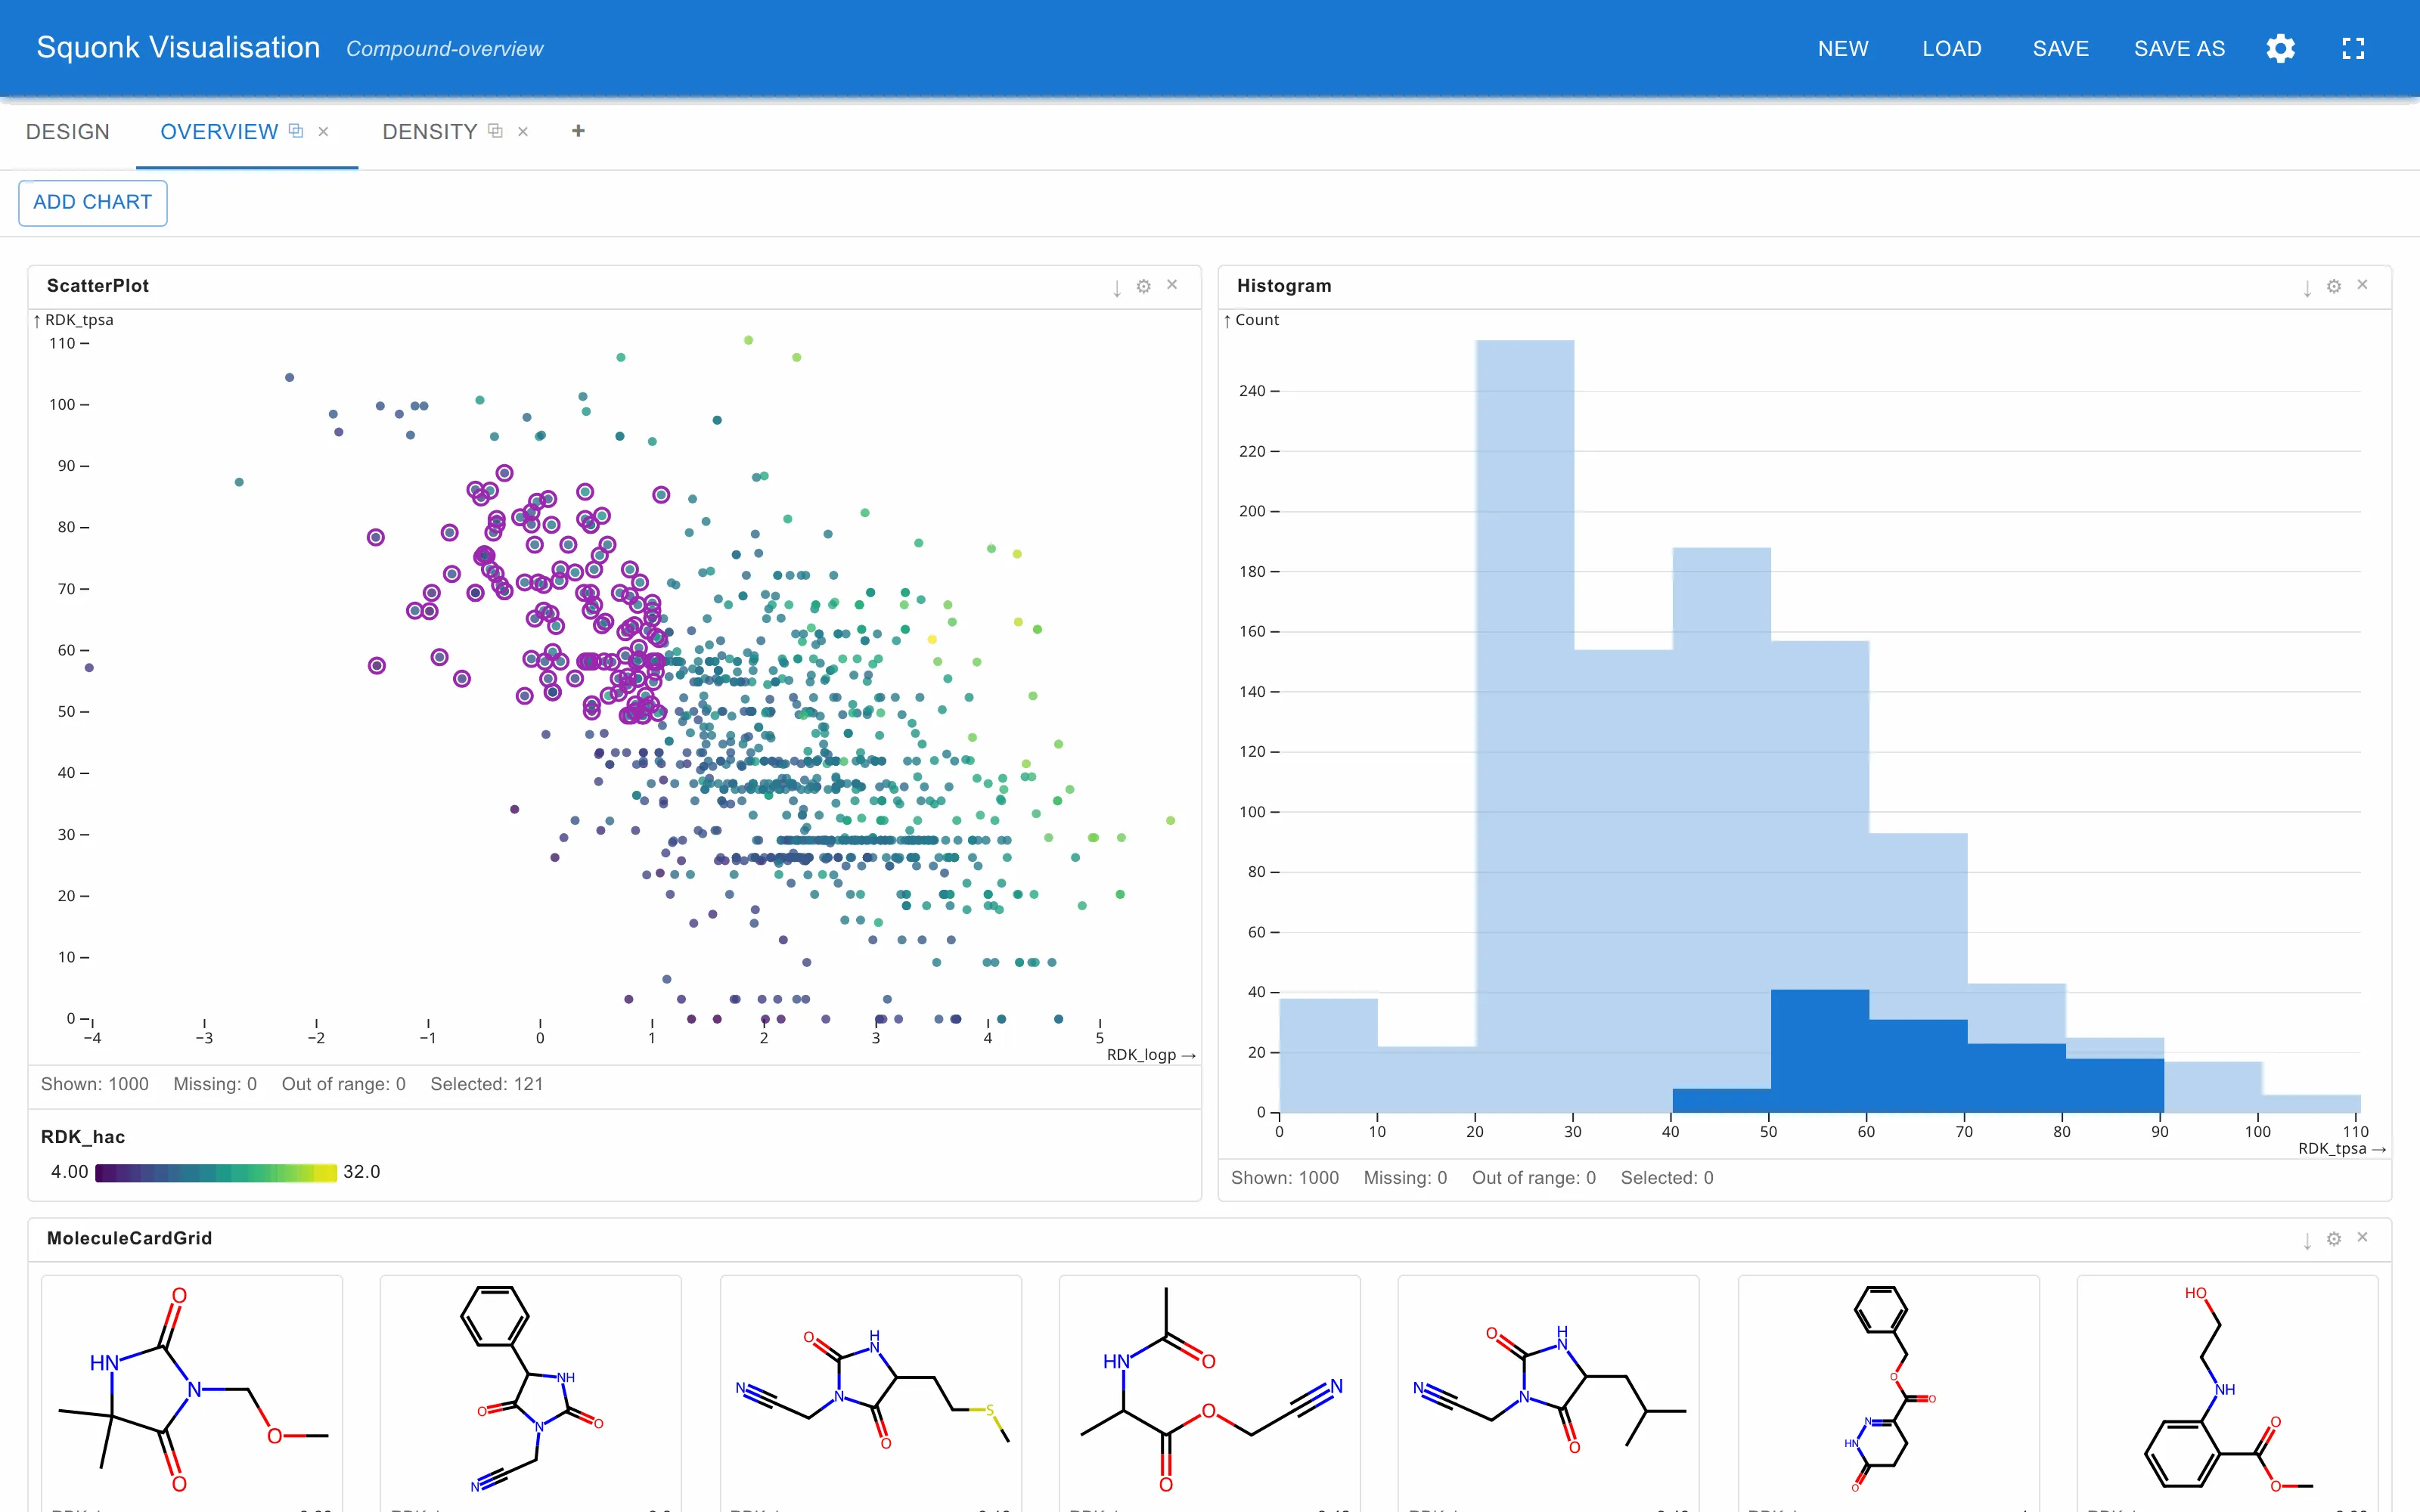
View tabs are where you arrange those views and use them. Each view tab holds a resizable grid of the nodes you assign to it, and a view can be popped out into its own browser window for a second monitor. A selection made in one chart flows along the connections you drew, filtering or highlighting the others — including across a popped-out window.
The split matters because the two activities are different. Building is occasional and fiddly; looking is what you do for the rest of the session.
Where your work is kept
Configurations are saved as .viz.json files in a .visualisations directory
inside the project itself. They belong to the project rather than to your
browser, so they survive a reload, follow you to another machine, and are
visible to everyone else with access to that project.
Where to go next
- Getting started — launching the application, the app bar, and saving a visualisation into your project.
- The design tab — the canvas, and how connections work.
- Components — every node, in three families: data, charts and molecular.
- Views — arranging charts, and opening a view in its own window.
- Settings — the application’s settings, named presets, and how each chart’s own settings work.
- Wiring patterns — the combinations worth knowing.
- Reference — keyboard shortcuts, file formats and troubleshooting.