Views
A view tab is a resizable grid of the charts you assign to it. One visualisation can have several — an overview and a detail view, say, or one per question you keep asking of the data — all drawing on the same wiring.
Managing tabs

- + at the end of the strip adds a view.
- Double-click a tab to rename it.
Enterconfirms,Escapecancels. - ✕ closes it. That removes the view and its layout — the nodes stay on the canvas, so nothing else is lost, but the arrangement is. There is no confirmation, so rename rather than close-and-recreate if you can.
- ⧉ opens the view in its own window — see below.
Putting charts in a view
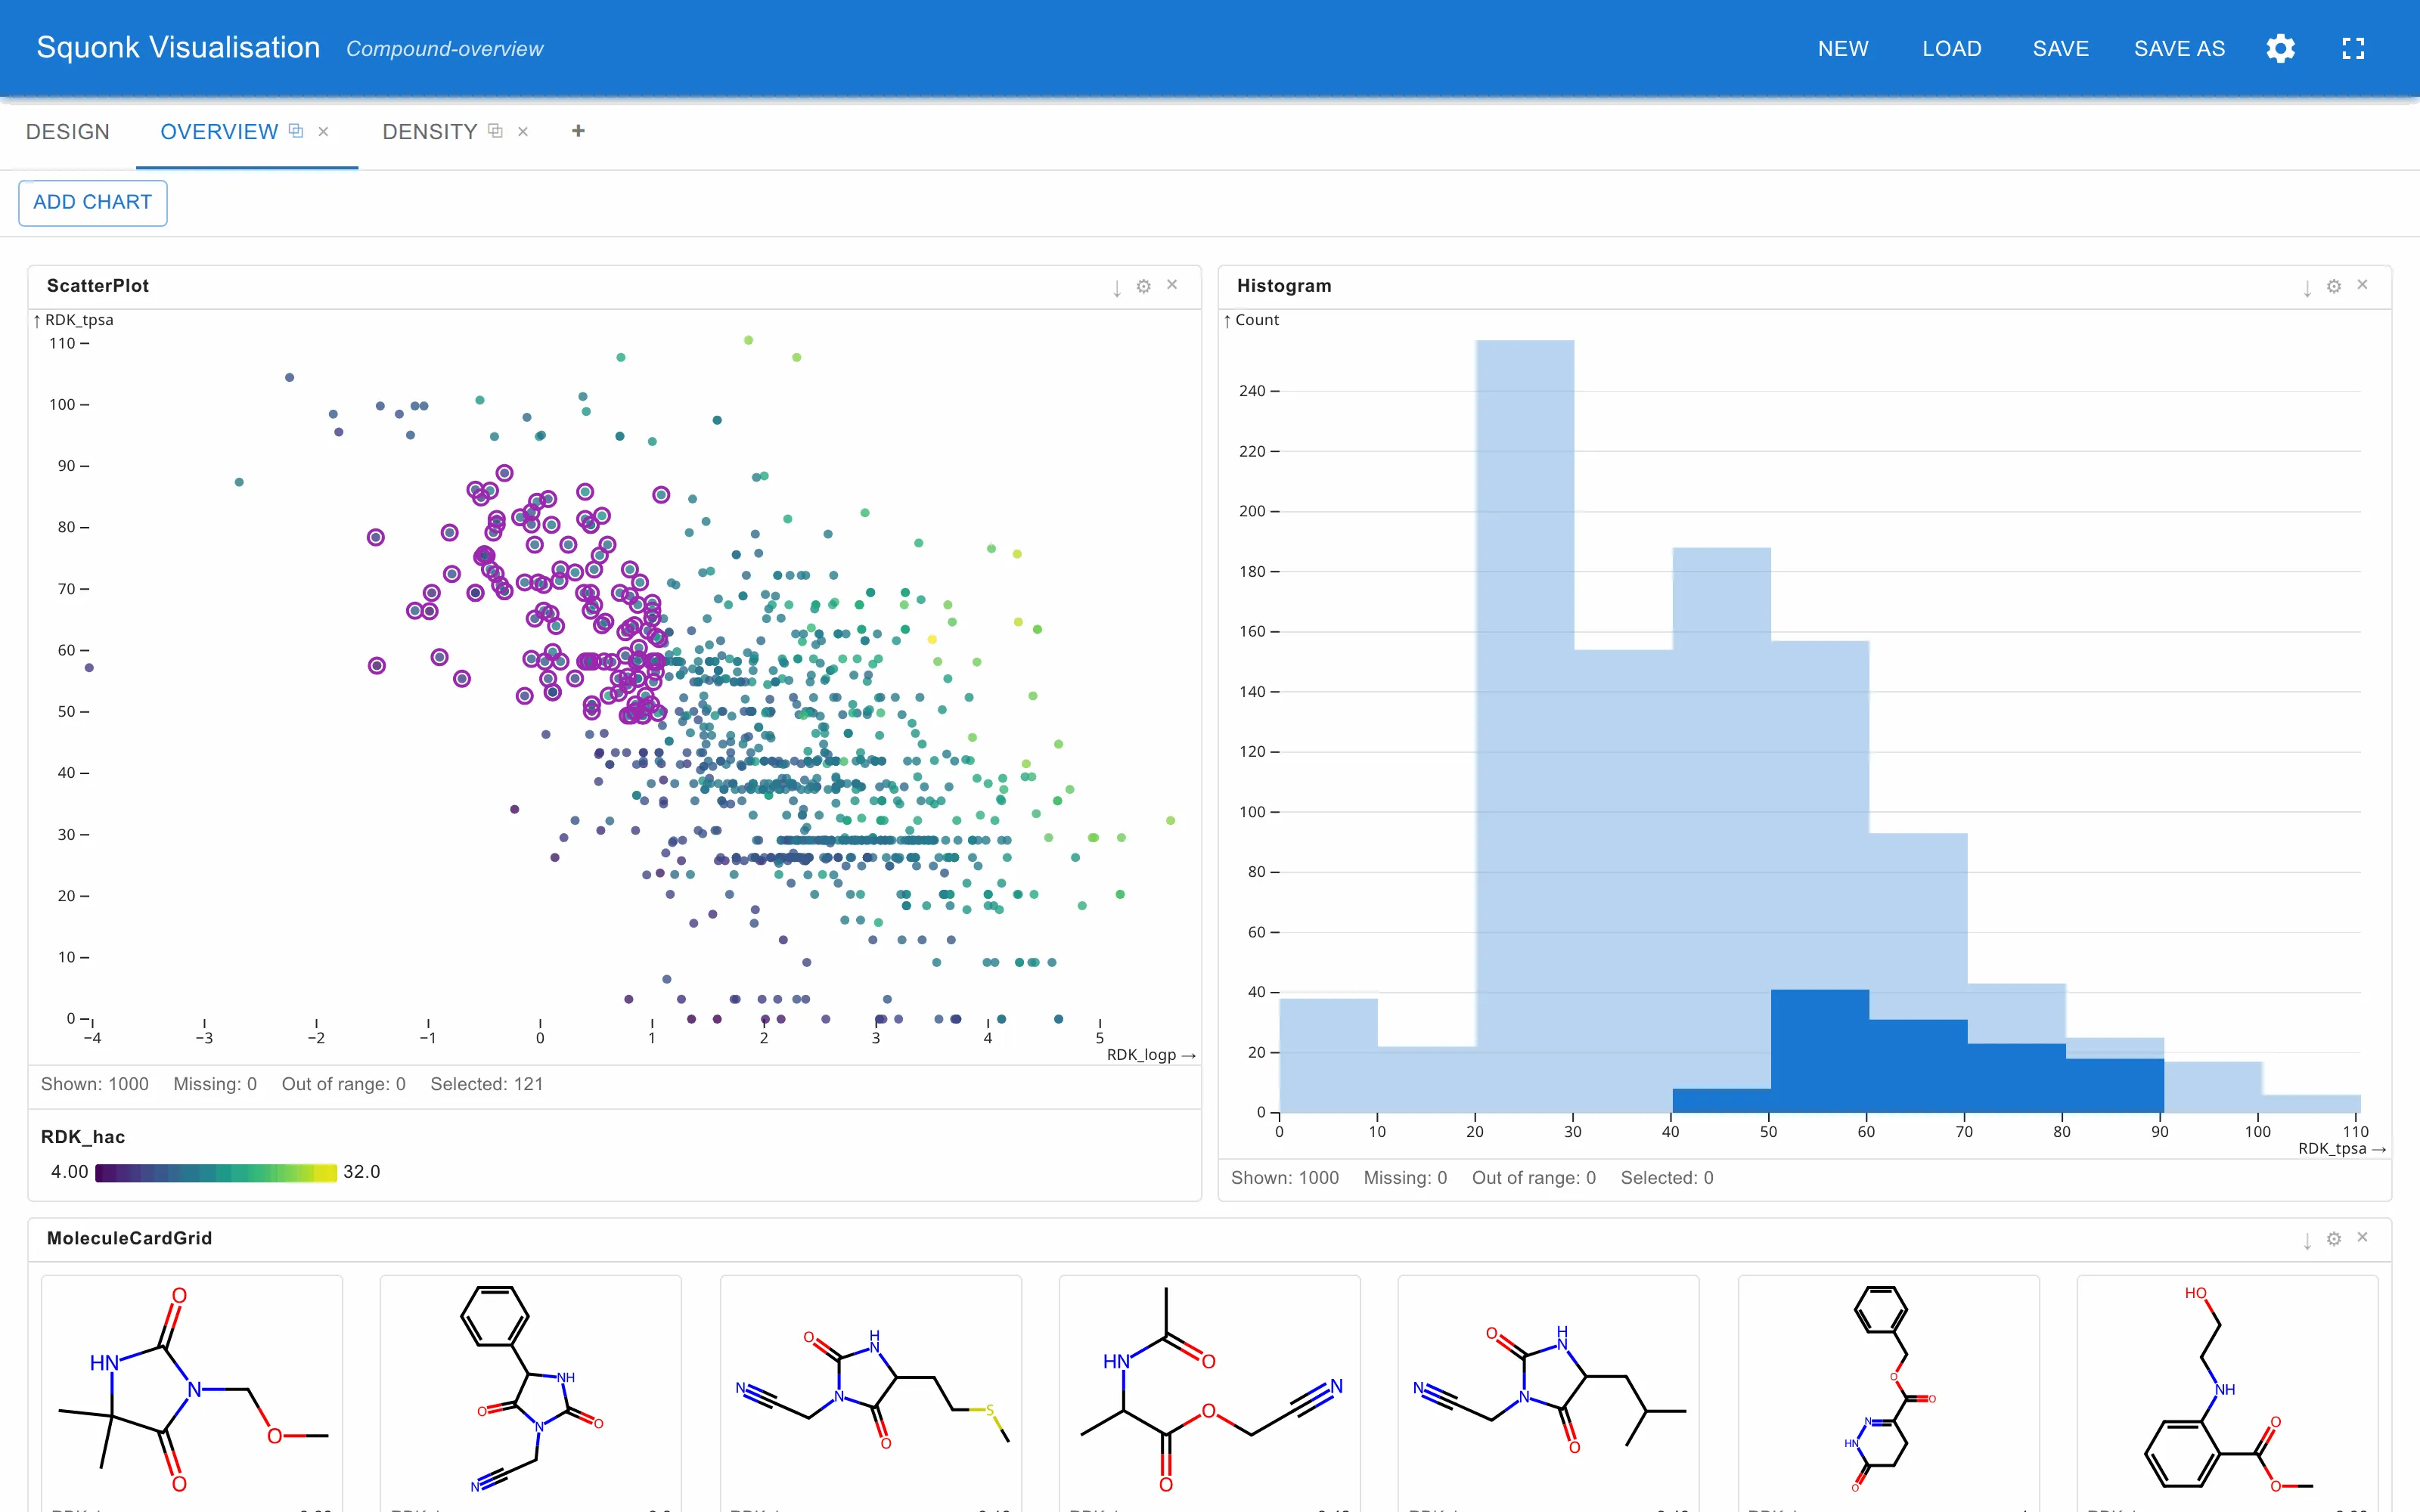
Add chart lists the chart nodes from the Design tab that are not already in this view, and adds the one you pick as a panel. Once every node is placed the button is greyed out.
The same node can be in several views at once. Each view keeps its own layout, and its own settings for that node — the same scatter plot can be on a log scale in one view and a linear one in another.
The alternative is the Assign nodes to views grid on the Design tab, which shows every node against every view at once. Use whichever suits: they do the same thing.
Arranging panels
- Move — drag a panel by its title bar.
- Resize — drag the handle at its bottom-right corner.
- Remove — the ✕ on the panel’s title bar takes it out of this view. The node stays on the canvas and can be added back.
Layouts are part of the visualisation, so they are saved with it.
The panel title bar
Every panel carries its name on the left and its actions on the right.
| ↓ | Export — see below |
| ⚙ | This chart’s settings |
| ✕ | Remove from this view |
The ⚙ opens the settings for that chart: scales, ranges, binning, colours, tooltips, and whatever else it offers. What it does not contain is the choice of fields, which lives on the node in the Design tab. See Settings for how these work.
Export offers Copy as PNG, Download PNG and Download SVG for the 2D charts and both interaction views, Copy as PNG and Download PNG for the 3D viewer, and page/selection PNG and SDF downloads for the molecule grid. The sketcher, the R-group table and the mutation-shells view have no export.
The status bar
Most charts carry a line along the bottom that says what you are looking at.
| Shown | Rows drawn — after any filter arriving from another chart |
| Missing | Rows dropped because a field they need is empty or not a number |
| Out of range | Rows outside an axis range you have set, or beyond a cap |
| Selected | Rows currently selected in this chart |
It is the quickest way to tell an empty chart apart from a broken one: 1000 shown and 1000 missing means the field is not what you think it is, and 0 shown with 1000 out of range means an axis minimum is in the way.
Opening a view in its own window
The ⧉ beside a tab’s ✕ moves that view into a separate browser window, which you can drag onto a second monitor. Click it again — or Return to tab in the emptied tab, or just close the window — to bring the view back.
The wiring keeps working across the two windows. A selection made in the main window still filters a chart in the popped-out one, and the other way round. Nothing needs configuring.
Several views can be out at once. Renaming the tab renames its window with it, so a row of them stays identifiable in the taskbar.
Worth knowing:
- Popping a view in or out rebuilds its charts. That is inherent in moving them to a different window: a 3D view takes a moment to reload and each chart’s own selection resets. Selections wired between nodes survive.
- Your browser may block the pop-up the first time. If it does, the view stays where it was and a warning appears; allow pop-ups for the site and try again.
- A window that is completely covered, or on a closed laptop lid, stops drawing. A 3D view in it will appear frozen until you reveal it again.
- Which windows are open is not saved. Reloading the main window closes them all.