Getting started
Launching it from a project
The Visualisation Designer runs as an application inside a Data Manager project, alongside your data rather than on your own machine.
- Open the project whose data you want to look at.
- Go to Run, find the DataVisualisation application, and start it. The launch dialog asks for a Viz application version — unless you have a reason to pin an older one, take the newest.
- When the instance is running, open it from Results.
The application then reads the project directory directly. There is nothing to upload and nothing to download: the files it lists are the files in the project, and the visualisations you save go back into the same place.
An instance you stop using is eventually shut down by the Data Manager to free resources. That costs you nothing as long as you have saved: your visualisations live in the project, not in the instance. Launch it again and load them back.
The app bar

| Title | Your name, or the project — whatever the Data Manager told the instance about itself |
| Name | The visualisation you are editing, in italics. Untitled until you have saved one |
| New | Start again with an empty canvas. If there are unsaved changes it asks first |
| Load | Open one of the visualisations saved in this project |
| Save | Write your changes back under the current name. Greyed out when there is nothing unsaved to write |
| Save as | Save under a new name, which then becomes the current one |
| ⚙ | Settings |
| ⛶ | Full screen, and back again |
Saving into the project
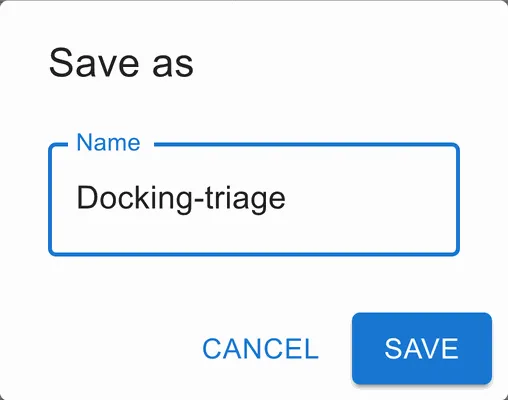
Save as asks for a name and writes a .viz.json file into a
.visualisations directory inside the project, creating that directory the
first time. Because the file is in the project, everyone with access to the
project can open it, and it is still there when you launch a new instance
tomorrow.
The name becomes part of a filename, so anything that is not a letter, a digit,
a hyphen or an underscore is replaced with a hyphen: Docking triage is saved
as Docking-triage.
Load lists what is there, with the date each was last saved.
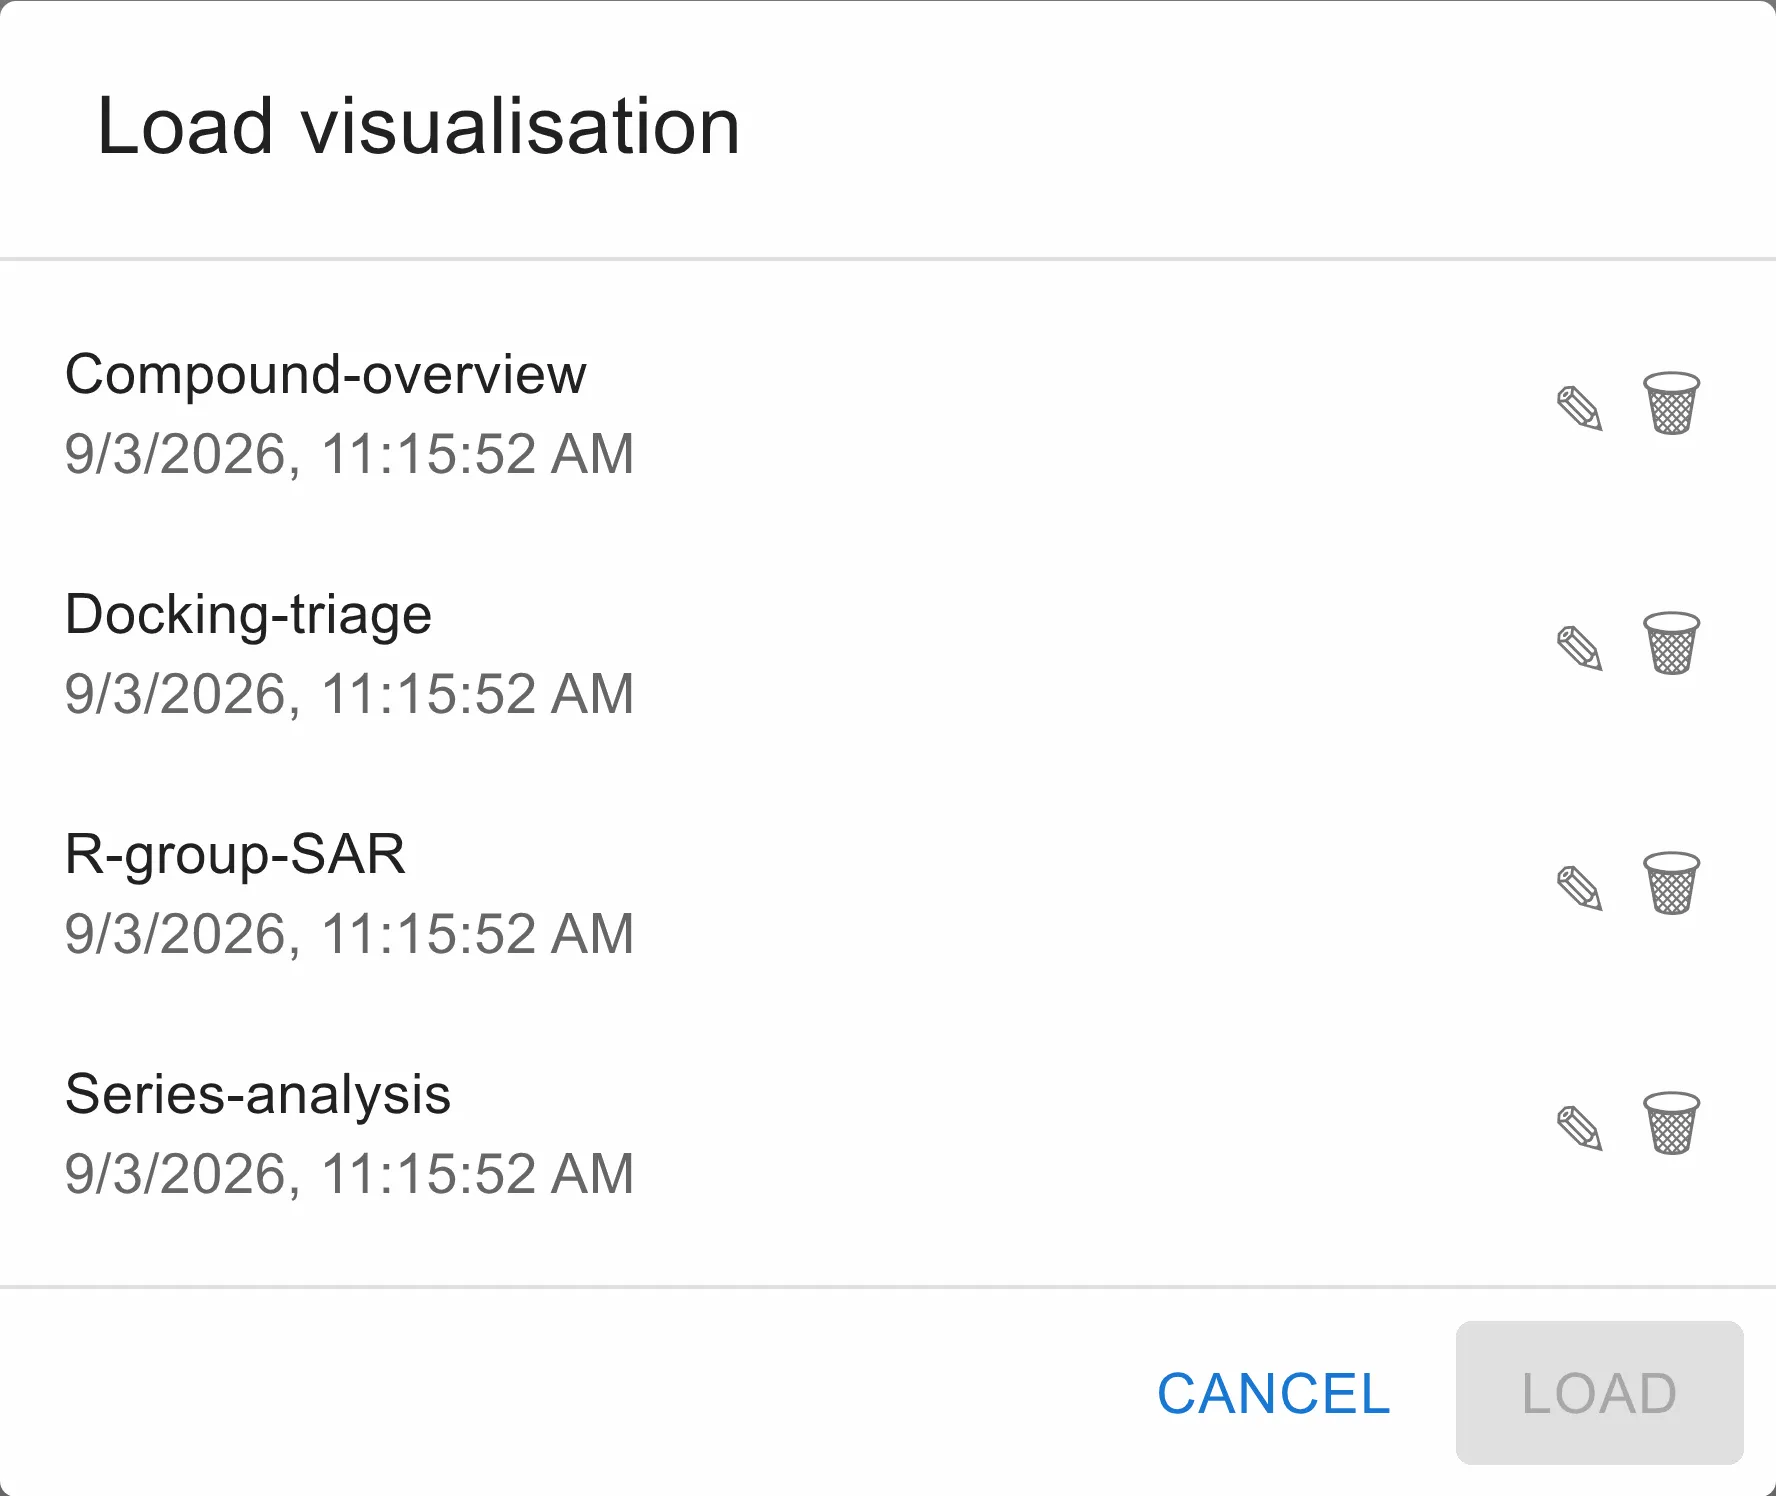
Click a name and then Load, or double-click it. The ✎ beside each entry renames it and the 🗑 deletes it — deleting asks for confirmation, and cannot be undone.
Loading a visualisation replaces what is currently on screen. Save first if you want to keep it.
Once a visualisation has a name, Auto save can save it after each change for you. It is one of the application settings.
Settings
The ⚙ in the app bar opens the application’s settings. It holds the Defaults that charts fall back on, the named Presets that charts share, and Auto save. These are stored in the project, so they are the same for everyone working in it. All of them, along with how each chart’s own settings work, are described under Settings.
Which files the application can see
The application lists the project directory recursively and offers everything it recognises:
| Kind | Extensions |
|---|---|
| Structures with data | .sdf, .sd |
| Tabular data | .csv, .tsv, .tab |
| SMILES lists | .smi, .txt |
| Protein structures | .pdb, .mmcif, .cif |
Compressed forms — .sdf.gz, .csv.gz and so on — are read directly, with no
need to unpack them first. The .visualisations directory itself is not
offered as data.
Files are read only when a node asks for one, so a project full of large files costs nothing until you pick one.