Settings
Settings come in three layers, and the difference between them is mostly about who else a change affects.
| Layer | Set in | Affects | Stored in |
|---|---|---|---|
| Application settings | ⚙ in the app bar | Every visualisation in the project | The project |
| Presets | ⚙ in the app bar → Presets, then chosen in a chart’s ⚙ | Every chart that names the preset, in every visualisation in the project | The project |
| Component settings | ⚙ on a panel’s title bar | That one chart, in that one view | The visualisation |
The first two live in the project’s .visualisations directory, beside your
saved visualisations, so they are the same for everyone working in the project
and still there the next time you launch the application. Component settings
live inside the visualisation’s own .viz.json and travel with it. The files
are listed under Reference.
Application settings
The ⚙ in the app bar opens the application’s settings.
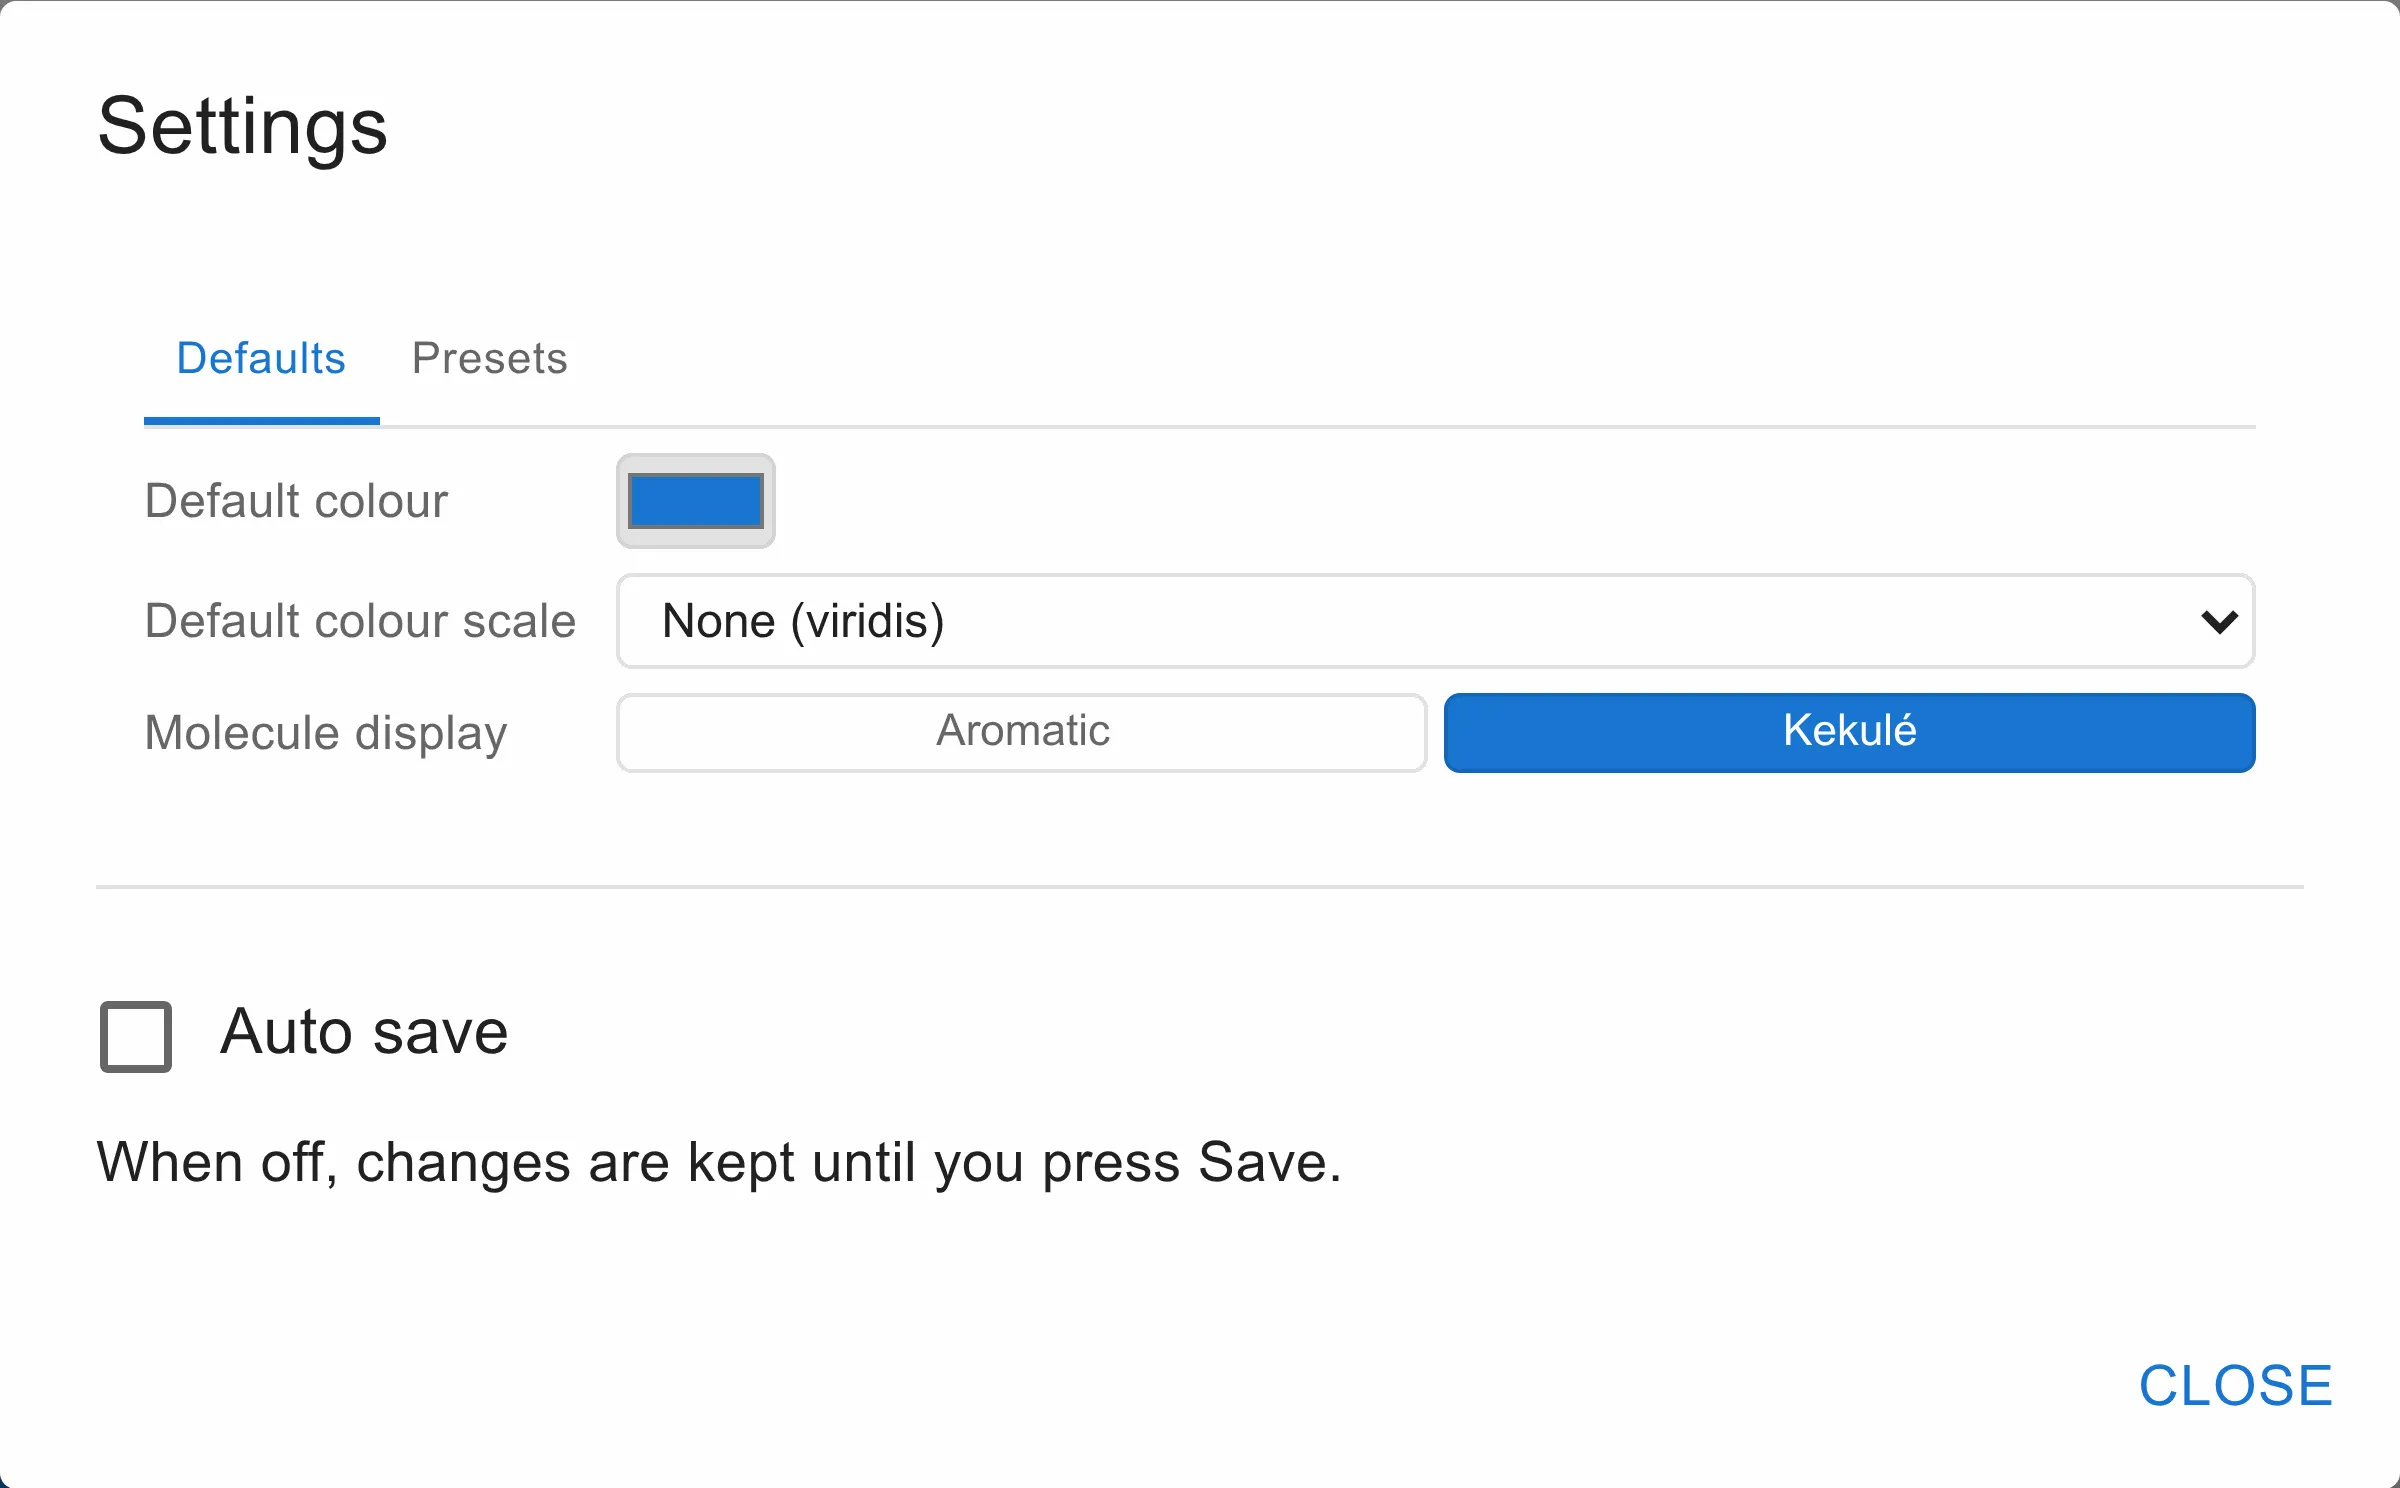
It has two tabs, Defaults and Presets (the latter is described below), and the Auto save checkbox underneath them.
Defaults
| Setting | What it does |
|---|---|
| Default colour | The colour a chart draws in when nothing is mapped to colour and the chart has no base colour of its own |
| Default colour scale | The colour ramp a chart uses when a field is mapped to colour and the chart has no colour scale of its own |
| Molecule display | Whether 2D structures are drawn with aromatic rings or in Kekulé form |
A default is followed, not copied. A chart that has no colour or colour scale of its own uses the current default. So when you change the default, every such chart changes with it, including ones already on screen. A chart you have given its own base colour or colour scale keeps it. To put it back onto the default, use the ↺ beside its Base colour, or pick Default (…) at the top of its Colour scale list. Both are described under Chart components.
Molecule display applies to every 2D structure: the molecule grid and its PNG exports, the R-group table’s cells and headers, structures drawn in tooltips, and the anchor molecule in MutationShells. Changing it redraws them straight away. The one exception is the interaction diagram’s ligand, which the diagram draws itself.
Auto save
Auto save saves your work about half a second after each change. It only applies once the visualisation has a name, so until you have used Save as there is nothing for it to write to. With Auto save off, the Save button lights up whenever there is something unsaved. See Getting started for how saving works.
Presets
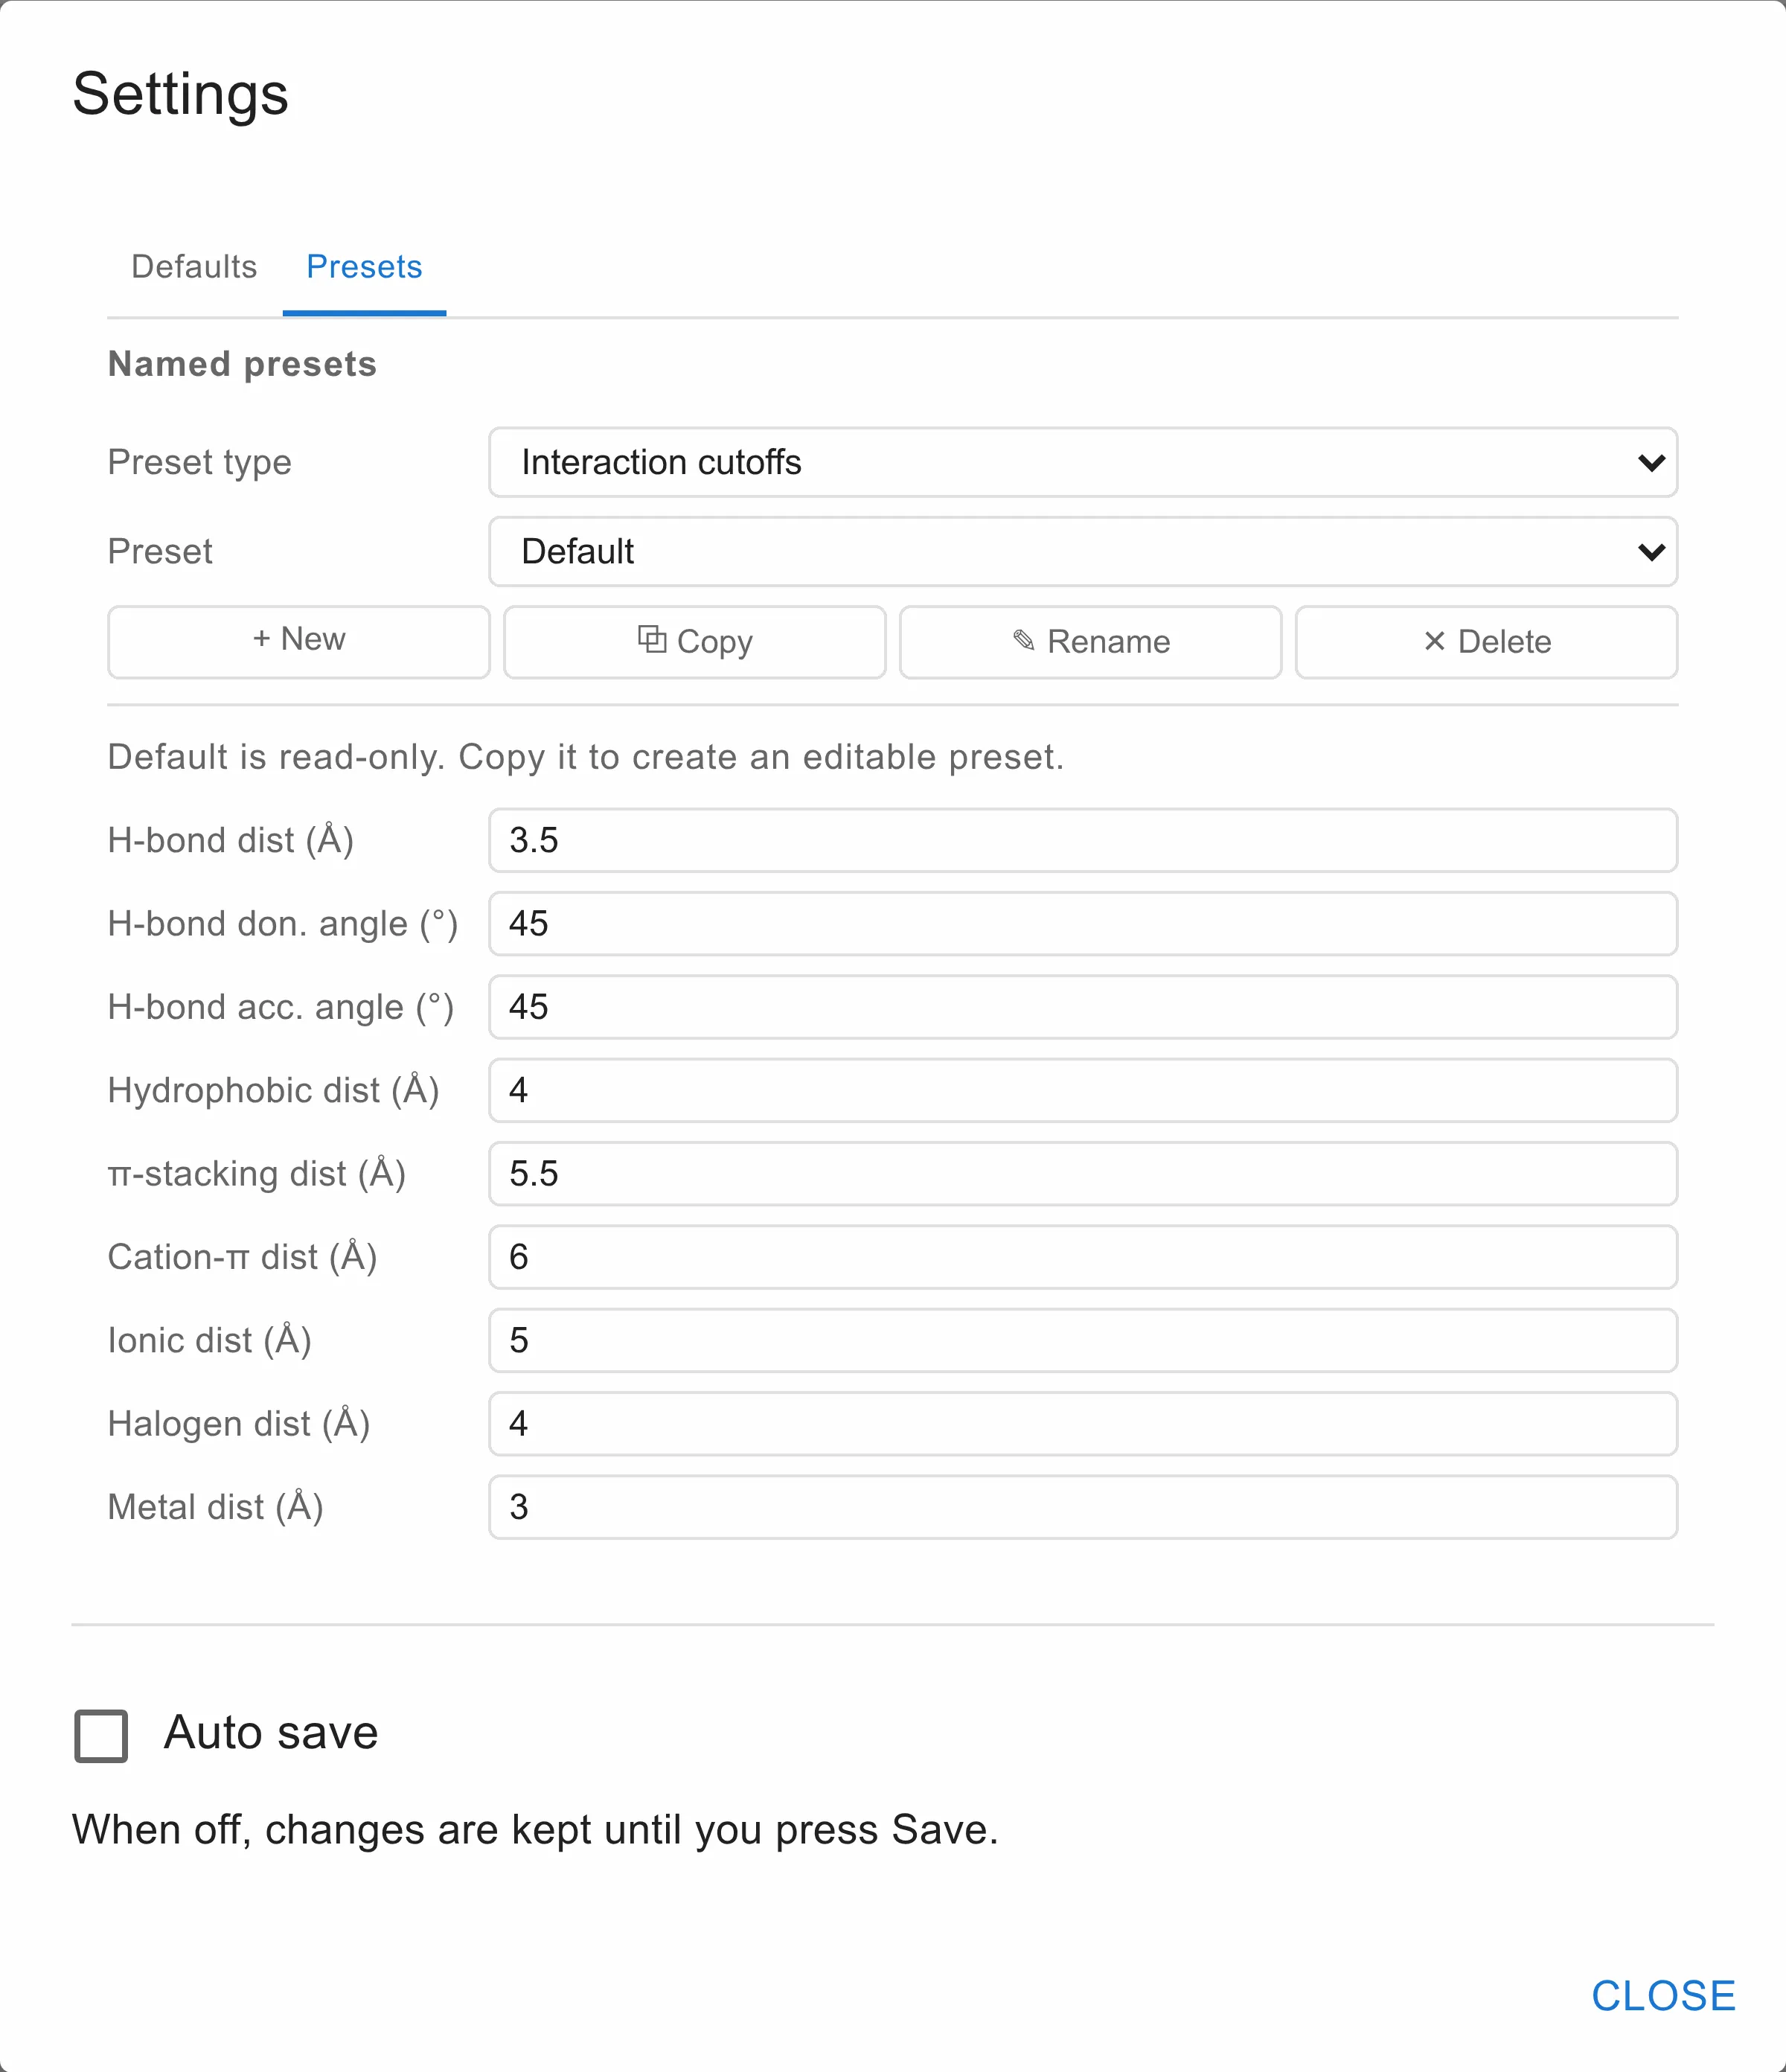
Some settings are worth defining once and sharing, rather than repeating in every chart. A preset is a named set of those values. You define it once under Settings → Presets, and each chart then picks the one it wants, by name.
The main reason is consistency, not saving keystrokes. When two charts point at one preset, editing the preset updates both immediately, so they cannot drift apart. That matters most where drifting apart would change what the data says. If the interaction map and the 3D overlay used different H-bond cutoffs, they would show different contacts from the same poses, and nothing on screen would say why.
The kinds of preset
There are three kinds today. All three happen to be used by molecular components, but the mechanism is not tied to them.
| Preset type | What it carries | Used by | Chosen on the chart’s |
|---|---|---|---|
| Interaction cutoffs | The geometry that decides what counts as a contact | Interaction map, interaction diagram, 3D viewer | Algorithm tab |
| Interaction types | Which of the ten interaction types are shown | The same three | Appearance tab |
| 3D viewer display | How the 3D viewer draws ligands and proteins | The 3D viewer | Appearance tab |
The row in a chart’s ⚙ uses the same words as the Preset type, so you can tell which preset a row is asking for.
Interaction cutoffs. Nine values can be edited:
| Default | |
|---|---|
| H-bond dist (Å) | 3.5 |
| H-bond don. angle (°) | 45 |
| H-bond acc. angle (°) | 45 |
| Hydrophobic dist (Å) | 4 |
| π-stacking dist (Å) | 5.5 |
| Cation-π dist (Å) | 6 |
| Ionic dist (Å) | 5 |
| Halogen dist (Å) | 4 |
| Metal dist (Å) | 3 |
Changing them re-runs contact detection, which costs roughly 40 ms per ligand.
Interaction types. Which of the ten kinds of interaction are shown: H-bond, backbone H-bond, weak H-bond, water H-bond, hydrophobic, π-stacking, cation-π, ionic, halogen bond and metal coordination. Changing them costs nothing: every type is detected in one pass, and this preset only filters what is shown.
3D viewer display. Six settings: ligand style, ligand colouring, how far unmarked ligands recede, protein style, which of cartoon / ribbon / surface are overlaid on the protein, and protein colouring. A 3D viewer takes these values only from its preset; the viewer itself has no settings for them.
Making your own
Each kind starts with one preset, Default. It is read-only, cannot be deleted, and holds the built-in values. To make one of your own:
- Choose the Preset type.
- Select Default, or any preset you want to start from, and click Copy. Or click + New to start from the built-in values.
- Give it a name.
- Edit the values below. They are saved as you type.
Rename and Delete act on the selected preset.
To use a preset, open the chart’s ⚙ and pick the preset by name in the row for its kind.
Presets belong to the project
Presets are stored with the project’s settings, not inside any one visualisation. Two things follow from that:
- Editing a preset affects every visualisation in the project that names it, including ones your colleagues are working on. Make a copy if you want to experiment.
- A visualisation records only the preset’s name. Copy a
.viz.jsonto another project that does not have the same presets, and its charts fall back to the Default values. The chart’s ⚙ shows the preset’s name followed by (not defined) until you point it at another one. Renaming or deleting a preset has the same effect on every chart that used the old name, and the dialog warns you before it does it.
Component settings
Everything else is set on the component itself. There are two places, and which one a setting lives in depends on what kind of thing it is.
Fields are chosen on the node, in the Design tab: which column is the X axis, which holds the structures, which to colour by.
Everything else is behind the ⚙ on the panel’s title bar, in a view tab: scales, ranges, binning, colours, tooltips, and whatever else that component offers.
Component settings belong to the view. The same node can be in more than one view, and each view keeps its own settings for it. That lets the same scatter plot use a log scale in one view and a linear one in another, or a 3D viewer use a different display preset in each. The settings are saved with the visualisation, together with each view’s layout.
What the panels have in common
Tabs. A component with a lot of settings splits them into tabs. The tab names are the same across components: Fields, Axes, Appearance, Binning, Layout, Algorithm and Tooltip. Settings that limit how much work the component does, such as Require filter and Max ligands, are always under Algorithm. Settings that limit only how much is drawn go under Axes, Layout or Appearance. A component with only a few settings shows a single panel without tabs.
auto (…). A number box left blank shows the value the component worked
out for itself, as auto (…). Type a value to override it; clear the box to
go back to auto.
Tooltip. Every component with a configurable tooltip has its own Tooltip tab. There you list the fields that hovering should show. Left blank, the component shows its own default. If you list a molecule field, the tooltip draws the structure.
Each component’s own settings
What each component’s ⚙ offers is described with that component:
- Data components — the Dataset, Data Joiner, Calculated Fields and FileSelector nodes are configured on the node itself rather than through a ⚙.
- Chart components — including the settings the charts share: base colour, colour scale, Linear / Log, Asc / Desc and aggregation.
- Molecular components — including which of their settings come from a preset.